
Stock Market Mastering Momentum Trading with RSI, MACD & Breakout Patterns – Week 2
By CapitalKeeper | Weekly Education | Stock Market | Episode 2
Main Focus : Momentum Indicators & Chart Patterns
This week, we dive deeper into understanding how to gauge the strength and direction of price movements using momentum indicators and powerful chart patterns. These tools are crucial for timing your trades effectively and avoiding traps.
📘 Week 2 – Mastering Momentum: RSI, MACD & Breakout Patterns
By CapitalKeeper | Weekly Education | Stock Market | Episode 2
Welcome back to Week 2 of our CapitalKeeper Stock Market Education Series! After learning about candlestick patterns and support/resistance in Week 1, it’s time to dive into momentum indicators and breakout trading strategies—essential tools for identifying high-probability trades.
🚀 What You’ll Learn This Week:
- What is RSI (Relative Strength Index) and how to use it
- What is MACD (Moving Average Convergence Divergence) and how it signals momentum shifts
- Breakout Trading Strategy: How to catch big moves early
- Real Examples from Nifty 50 and Bank Nifty
CapitalKeeper Educational Series – Week 2, Day 1
RSI (Relative Strength Index) Simplified
- What is RSI and how it works
- Ideal RSI range (30–70) and how to spot reversals
- Divergence and its power in forecasting trends
- Real-life examples from Nifty 50 and Reliance
📌 Takeaway: How to use RSI to detect overbought/oversold zones before a breakout or breakdown.
📊 1. RSI – Spotting Overbought & Oversold Zones
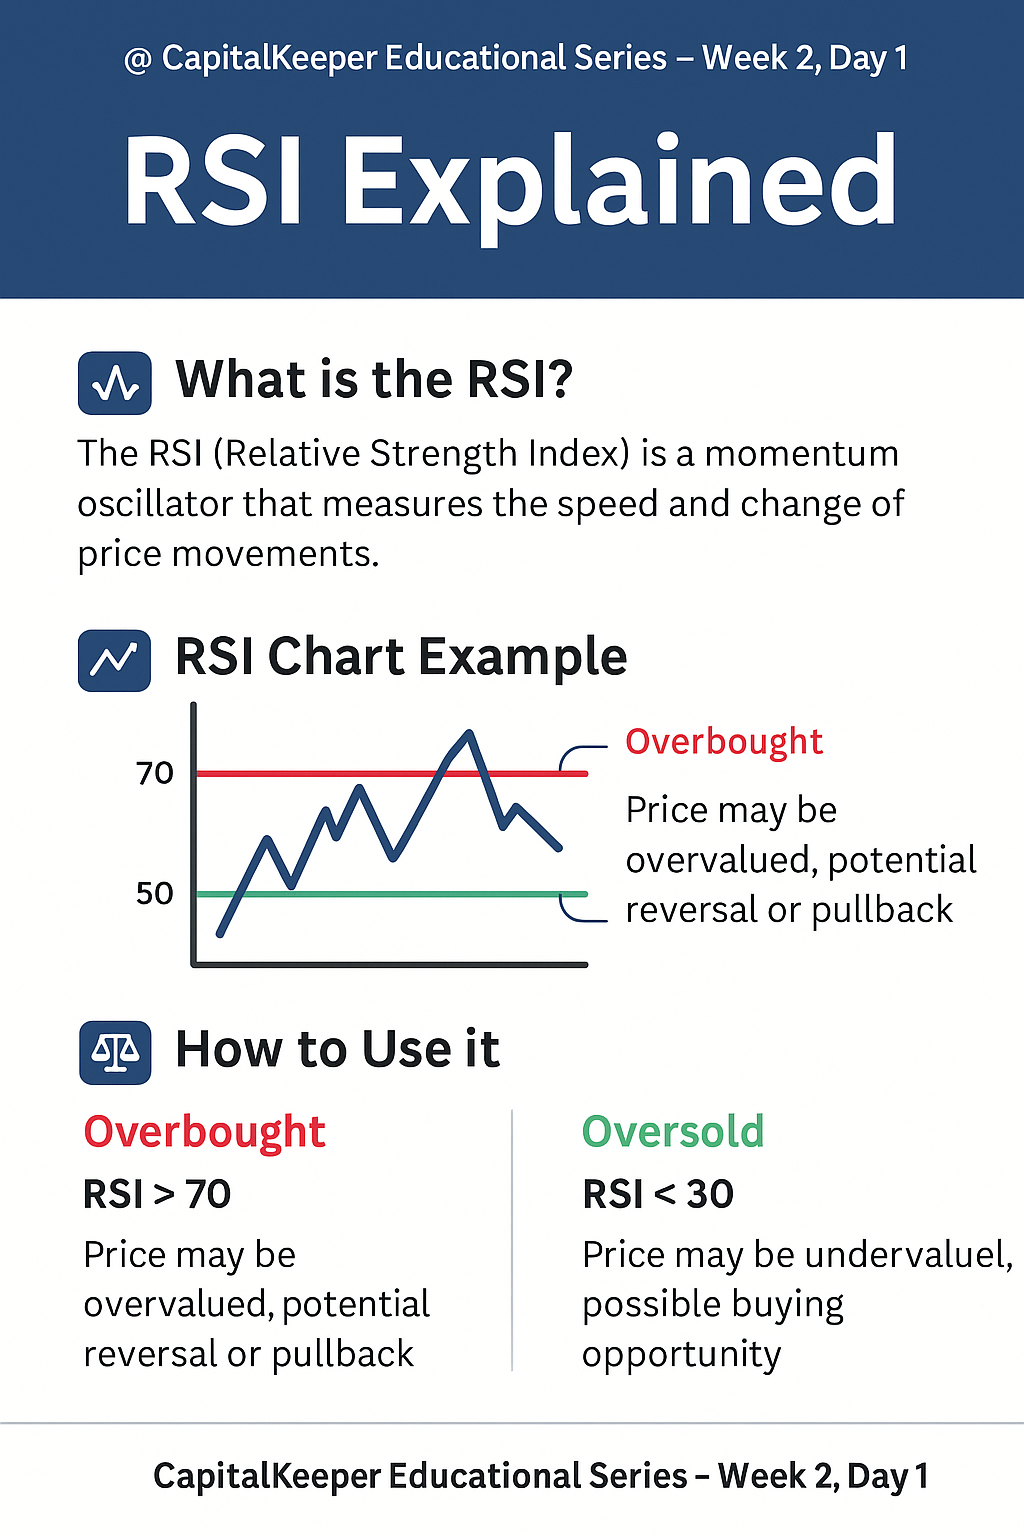
What is RSI?
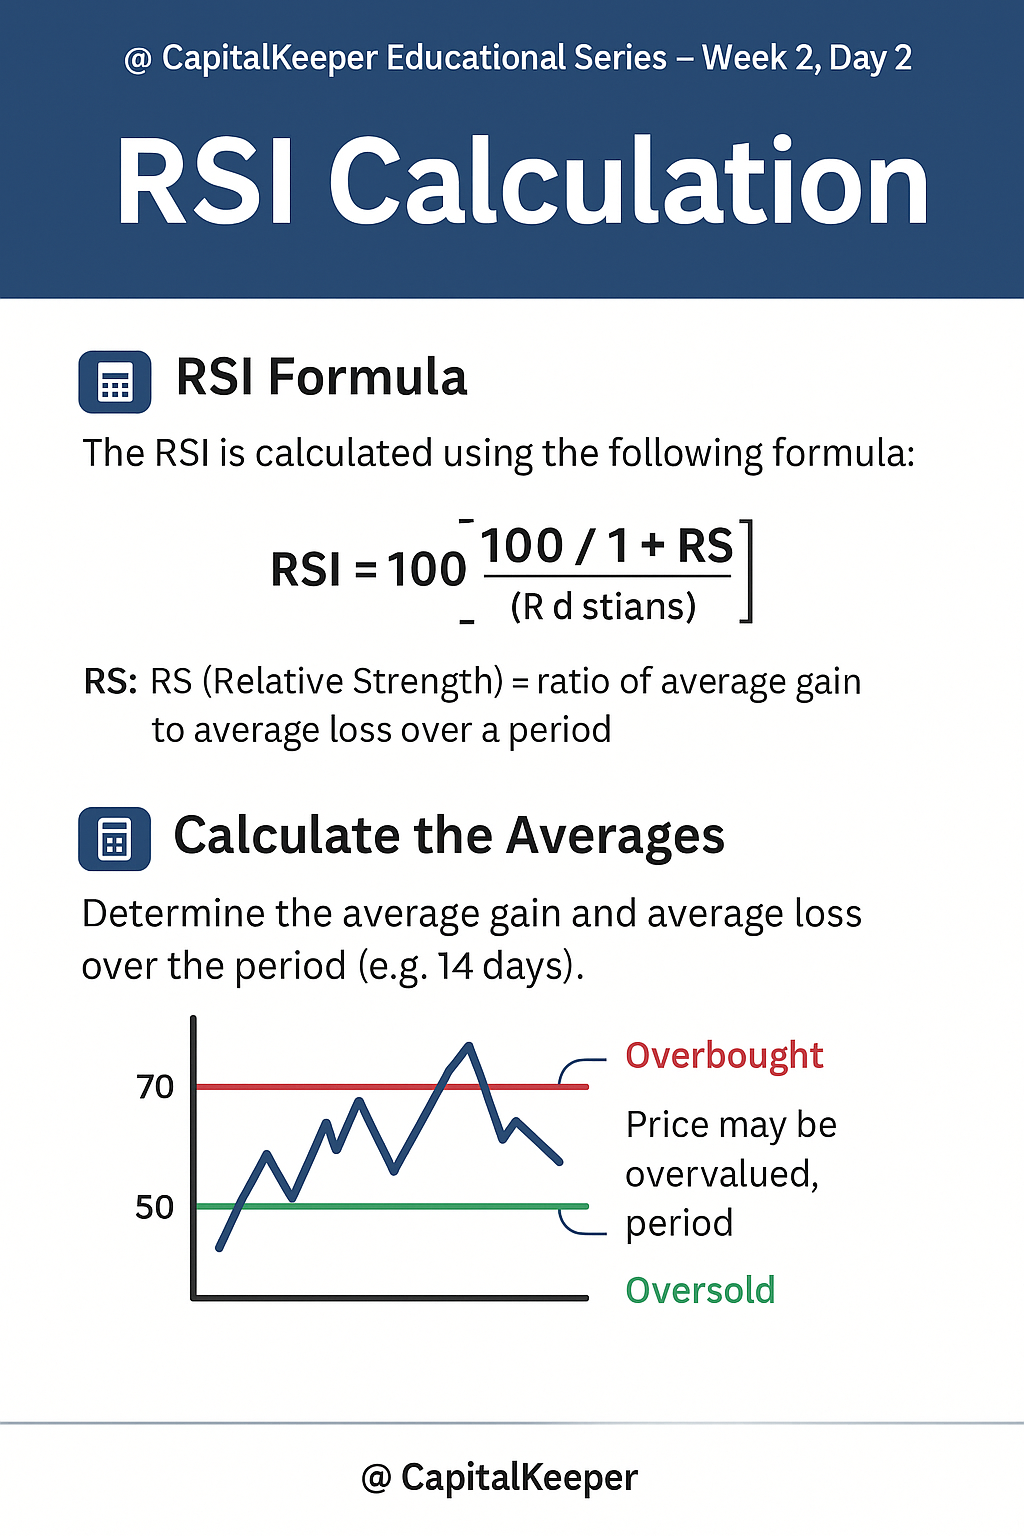
RSI is a momentum oscillator that measures the speed and change of price movements. It ranges from 0 to 100.
- RSI > 70 = Overbought (possible reversal or shorting opportunity)
- RSI < 30 = Oversold (possible buying opportunity)
How to Use RSI:
- Look for RSI divergences with price (Price makes new low, RSI doesn’t = bullish divergence)
- Combine RSI with support/resistance for stronger signals
📌 Example:
On 29th May 2025, HDFC Bank showed a bullish RSI divergence near ₹1530 with RSI bouncing from 32 → rallied to ₹1590 in 2 sessions.
📉 2. MACD – Identifying Trend Momentum & Reversals
MACD = 12-EMA – 26-EMA
- Signal Line: 9-EMA of MACD
- MACD Crossover above Signal Line = Bullish
- MACD Crossover below Signal Line = Bearish
Look for:
- Crossover near 0 line = strong momentum
- Divergence between MACD and price = early warning
📌 Example:
Axis Bank on 28th May showed a MACD crossover at ₹1135 with volume spike — confirmed a breakout to ₹1180.
💥 3. Breakout Patterns – Trade Like the Pros
Breakouts occur when price moves outside a consolidation or a key level. Two types:
- Range Breakout
- Trendline Breakout
Checklist Before Entering Breakout:
✔ Price above previous resistance
✔ Volume > 2x average
✔ RSI between 55–70 (strong momentum)
✔ MACD crossover confirmed
📌 Example:
L&T Finance broke out of ₹162 resistance with 3x volume on 30th May → RSI was 64, MACD bullish → stock touched ₹171 intraday.
🔍 Real Market Insights: Nifty 50 & Bank Nifty
🧠 Nifty 50:
After a brief correction, RSI held at 45 and reversed upward with price breaking 23,750. MACD also turned bullish. Watch for strength above 24,000 with targets of 24,250+.
🧠 Bank Nifty:
MACD crossover formed near 55,500 with RSI at 50. Price broke falling trendline — confirming momentum. Target range: 56,200–56,800.
💡 Tips for the Week:
- Always confirm RSI/MACD with price action and volume
- Avoid trades when RSI is between 40-60 unless a breakout setup is forming
- Use breakout pullbacks to re-enter
📚 Assignment:
Pick 3 Nifty or Bank Nifty stocks.
- Mark support/resistance zones
- Note RSI & MACD values
- Track them for the next 5 trading days
Let us know your results on
📅 What’s Coming in Week 3:
- Moving Averages (SMA vs EMA)
- Golden Cross & Death Cross
- Trend-Following Strategy for Swing Trading
CapitalKeeper Educational Series – Week 2, Day 2
Understanding RSI Zones & Divergence for Smarter Entries
MACD (Moving Average Convergence Divergence) for Swing Trades
- Basics: MACD Line, Signal Line, Histogram
- MACD crossover strategy
- Best timeframe to use MACD
- Case study: Bank Nifty and Tata Motors
📌 Takeaway: How to combine MACD with trendlines for precision entries.
Welcome to Day 2 of our momentum learning series! Yesterday we introduced RSI and MACD as essential tools. Today, we zoom into one of the most powerful and underrated techniques using RSI: RSI Zones & Divergence.
🔍 What is RSI Zone Theory?
RSI Zones help you understand not just overbought/oversold areas, but also trend strength.
| RSI Range | Market Behavior |
|---|---|
| 0–30 | Oversold (Look for buy) |
| 30–40 | Weak Bullish Zone |
| 40–60 | Sideways or consolidation |
| 60–70 | Strong Bullish Momentum |
| 70–100 | Overbought (Caution for reversal) |
🔄 RSI Divergence – Early Signal Before Price Moves
📉 Bearish Divergence:
Price makes higher high, RSI makes lower high
➡️ Warning: Momentum is weakening
📈 Bullish Divergence:
Price makes lower low, RSI makes higher low
➡️ Signal: Momentum reversal expected
✅ How to Use RSI Zones with Divergence
- Identify trend direction on chart
- Look for RSI divergence near strong levels (support/resistance)
- Combine with volume confirmation
- Watch for price action reversal candle (e.g., Hammer, Engulfing)
📌 Real Chart Example – TATA Steel (28th May 2025)
- Price: Made a new low of ₹161.40
- RSI: Made higher low near 36
- Volume: Increased
- Signal: Bullish divergence
- Outcome: Sharp reversal to ₹168+ by intraday close
📌 Real Chart Example – ICICI Bank (30th May 2025)
- Price: Topped around ₹1121 (new high)
- RSI: Lower high around 63 (previous was 70+)
- Volume: Below average
- Signal: Bearish divergence
- Outcome: Mild correction to ₹1098 within 1 session
✨ Strategy Tip:
Combine RSI zone reading with MACD confirmation and volume breakout to filter out false signals.
🎯 Day 2 Practice Task:
Pick any 2 trending stocks from Nifty 50:
- Draw support/resistance
- Check RSI levels and divergence
- Mark possible entry/exit points
🔮 Coming Up on Day 3:
- Mastering MACD Crossovers
- Spotting early trend reversals
- Combining RSI + MACD for stronger signals
CapitalKeeper Educational Series – Week 2, Day 3
🔁 Mastering MACD Crossovers & Trend Reversal Signals
Welcome to Day 3, where we decode the MACD Indicator — one of the most reliable tools for spotting early trend shifts and confirming breakouts.
⚙️ What is MACD?
MACD stands for Moving Average Convergence Divergence.
It tracks momentum and trend direction by comparing two EMAs:
- MACD Line = 12-EMA – 26-EMA
- Signal Line = 9-EMA of MACD Line
- Histogram = Difference between MACD & Signal line
✅ Key MACD Signals
| Signal Type | Interpretation |
|---|---|
| Bullish Crossover | MACD line crosses above signal line → Buy |
| Bearish Crossover | MACD line crosses below signal line → Sell |
| Histogram Reversal | Trend is losing steam, early exit sign |
📈 MACD in Breakouts: Confirmation is King
MACD is your go/no-go signal before acting on a breakout:
- ✅ MACD Rising + Histogram Expanding → Breakout likely to sustain
- ❌ MACD Flat or Diverging → False breakout possible
📌 Real Chart Example – Infosys (29th May 2025)
- Price: Breakout above ₹1440
- MACD Line: Crossed signal line with rising histogram
- Volume: Above average
- 🔍 Outcome: Sustained move to ₹1465+
📌 Real Chart Example – Maruti Suzuki (30th May 2025)
- Price: Breakdown below ₹12,100
- MACD: Bearish crossover, histogram turning red
- Volume: Spiked
- 🔻 Outcome: Fell to ₹11,850 within 2 sessions
🎯 Strategy: RSI + MACD Combo
Use this Power Combo to confirm strong setups:
- 🔎 RSI near 60–70 zone (for bullish)
- ✅ MACD bullish crossover
- 📊 Volume spike → Entry Trigger
- 🎯 SL below last swing low, trail for target
🧪 Day 3 Practice Task:
Pick any trending midcap stock from your watchlist:
- Mark MACD crossovers on chart
- Note price behavior post-signal
- Observe if breakout sustained or reversed
📥 Share your notes with the community at #CapitalKeeperEdu
🧭 Coming Up on Day 4:
💥 How to Spot Breakout Patterns
📊 Chart Structures like Flags, Triangles & Rectangles
📌 Combine Patterns with MACD/RSI for Explosive Entries
CapitalKeeper Educational Series – Week 2, Day 4
💥 Spotting Breakout Patterns: Triangles, Flags & Rectangles
Welcome to Day 4, where we learn how to identify breakout patterns and combine them with RSI & MACD for high-probability trade setups.
🔍 What is a Breakout?
A breakout happens when price moves out of a well-defined range, often accompanied by a surge in volume and momentum.
🔺 1. Ascending Triangle (Bullish)
- Structure: Horizontal resistance + rising support
- Signal: Breakout above resistance
- Confirmation: High volume + RSI > 60 + MACD crossover
📌 Example:
Indian Bank broke out above ₹596 on 30th May with high volume, MACD bullish crossover, and RSI around 65 → rallied to ₹619+
🔻 2. Descending Triangle (Bearish)
- Structure: Horizontal support + falling resistance
- Signal: Breakdown below support
- Confirmation: High volume + RSI < 40 + MACD bearish crossover
📌 Example:
Tata Motors DVR broke ₹500 support on 15th May with MACD cross down & RSI at 38 → fell to ₹468
🏳 3. Flag and Pennant Patterns (Continuation)
- Structure: Strong rally followed by short consolidation (flag or pennant)
- Signal: Continuation breakout with renewed volume
- Confirmation: RSI retests 60+, MACD continues to rise
📌 Example:
Finolex Industries showed a flag between ₹218–225 before breaking out to ₹248+
🧱 4. Rectangle (Range Breakout)
- Structure: Horizontal range between support & resistance
- Signal: Breakout above resistance or breakdown below support
- Ideal for: Intraday & swing trades
📌 Example:
ITC consolidated between ₹425–440, breakout above ₹440.70 → moved toward ₹488+
🎯 Strategy: Pattern + RSI + MACD = Winning Setup
| Criteria | Breakout Type | Confirmation |
|---|---|---|
| Pattern | Triangle / Flag / Rectangle | Clean structure on daily chart |
| RSI | Above 60 (bullish) / Below 40 (bearish) | Signals momentum |
| MACD | Bullish crossover (or bearish) | Trend confirmation |
| Volume | Spike at breakout point | Confidence in breakout |
🧪 Day 4 Practice Task:
Pick 2 stocks from your watchlist that are:
- In consolidation (tight range for 5–10 sessions)
- Forming triangle or flag patterns
- Near breakout zone
Mark trendlines and look for RSI >60 and MACD crossover.
🧭 Coming Up on Day 5:
🧠 Pattern Failure: What Happens When Breakouts Fail
🔁 Learn to Avoid False Breakouts
📉 Spot Traps Using Volume & Price Divergence
CapitalKeeper Educational Series – Week 2, Day 5
🚫 Failed Breakouts & Bull/Bear Traps: Avoiding the Pitfalls
How to Spot False Breakouts (Traps)
- Why most traders lose money on breakouts
- Difference between fakeouts and genuine moves
- Use of volume + RSI for confirmation
- Examples from Zomato, Adani Ports
📌 Takeaway: Avoid common traps and boost your win-rate.
Here is Day 5 of Week 2 in the CapitalKeeper Educational Series. Today’s lesson is all about identifying failed breakouts and avoiding bull/bear traps — a crucial part of mastering price action.
❗ Why Do Breakouts Fail?
A failed breakout occurs when price moves above resistance or below support, luring traders into a position, but quickly reverses, trapping them.
This results in a false breakout, often driven by:
- Lack of volume
- Divergence in momentum indicators (RSI, MACD)
- Institutional stop-hunting
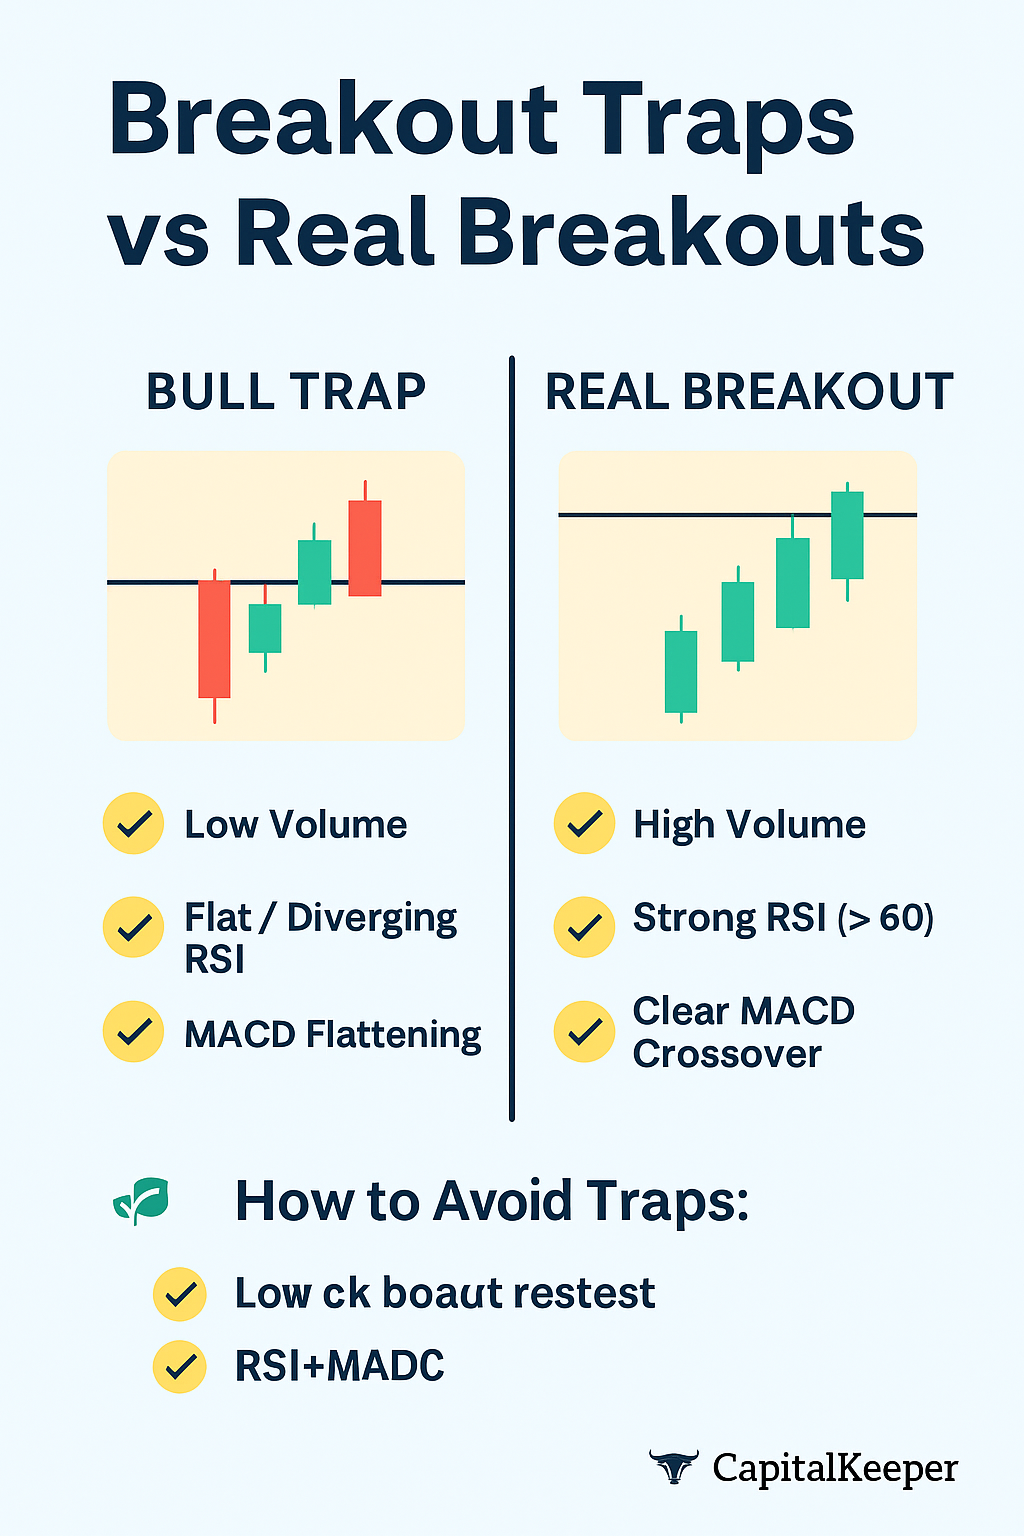
🚩 1. Bull Trap (False Upside Breakout)
Occurs when price breaks above a resistance level but reverses quickly below it.
🔍 Signs of a Bull Trap:
- Breakout with low volume
- RSI fails to sustain above 60
- MACD starts to flatten or diverge
- Candle closes back inside the previous range
📌 Example:
ITC broke out above ₹440.70 but failed to sustain. RSI remained flat near 58 and volume was weak → price reversed toward ₹425.
🐻 2. Bear Trap (False Breakdown)
Occurs when price breaks support and reverses back above, trapping short-sellers.
🔍 Signs of a Bear Trap:
- Breakdown on low volume
- RSI fails to stay below 40
- MACD doesn’t confirm the bearish move
- Quick bullish engulfing candle right after breakdown
📌 Example:
SBIN briefly dropped below ₹780 but closed above it the next session with bullish MACD & RSI bounce from 42 → Rally to ₹800+
⚠️ How to Avoid Traps:
| 🔍 Factor | 🔓 Valid Breakout | 🚫 Failed Breakout |
|---|---|---|
| Volume | Surge at breakout point | Low or no increase |
| RSI | Strong >60 (bullish) / <40 (bearish) | Flat / Diverging |
| MACD | Clear crossover | Weak / Flattening |
| Retest | Successful retest of breakout zone | Reversal with strong candle |
| Candle Pattern | Bullish Marubozu / Engulfing | Rejection wicks / Doji |
Day 5 Practice Task:
Pick a recent breakout in Nifty 50 or Bank Nifty stock that:
- Looked like a breakout initially
- But reversed after a session or two
Ask:
- Was volume confirming?
- Did RSI diverge?
- Did MACD confirm the move?
💡 Bonus Tip:
✅ Always wait for close above resistance or below support with confirmation from volume, RSI & MACD.
🚫 Don’t jump in during the first 5-minute candle on a breakout day without confirmation.Breakout Chart Patterns: Cup & Handle, Ascending Triangle
- Recognizing high-probability breakout patterns
- Volume confirmation during breakout
- Entry, stop loss, and target rules
- Examples from Midcap IT and Smallcap Pharma stocks
📌 Takeaway: Learn to ride momentum with breakout formations.
🧭 Summary of Week 2 (Momentum & Breakouts)
- Day 1: RSI – Overbought/Oversold
- Day 2: MACD – Crossovers & Divergence
- Day 3: RSI + MACD Combo Strategy
- Day 4: Breakout Patterns (Triangles, Flags, Rectangles)
- Day 5: Failed Breakouts & Trap Signals
📅 Day 5 – Strategy Friday: Intraday Setup Using RSI + Price Action
- 3-step rule for intraday scalping
- Entry at confluence zones (support + RSI 40 bounce)
- Practical chart: Fin Nifty Intraday Playbook
📌 Takeaway: Combine indicators and price action for reliable intraday setups.
“When the market rests, you prepare. Successful traders treat weekends as planning sessions—not vacations.” – CapitalKeeper

📌 For more real-time updates, trade setups, and investment insights — follow us on [Telegram] and subscribe to our newsletter!
Educational Blog Disclaimer
Episode [1]: Stock Market Beginner’s Weekly Guide
1. Educational Purpose Only
This blog series is purely for educational and informational purposes. The content, including stock examples, strategies, and market analysis, is not financial advice. Always consult a SEBI-registered advisor before making investment decisions.
2. No Guarantee of Returns
Past performance ≠ future results. Stocks, mutual funds, and other securities carry market risks. We do not claim any stock will deliver profits or multi-bagger returns.
3. Conflicts of Interest
- The author/blog may hold positions in discussed stocks.
- This is not a recommendation to buy/sell any security.
4. Data Accuracy
While we strive for accuracy, market data (prices, ratios, etc.) may change after publishing. Verify figures from NSE/BSE/Moneycontrol before acting.
5. Your Responsibility
Investing requires due diligence. You are solely responsible for your capital allocation.
6. Regulatory Compliance
This content adheres to SEBI’s Investor Protection Guidelines. No paid promotions or undisclosed partnerships are involved.


Leave a Reply