


Stock Market Beginner’s Weekly Educational Guide 3 : Chart Patterns ,Volume Analysis & Breakout Strategies by CapitalKeeper
By CapitalKeeper | Weekly Education | Stock Market | Episode 3
Welcome to Week 3 of our stock market mastery series! This week, we’re cracking the code of 12 most powerful chart patterns that professional traders use daily, volume analysis and breakout trading – the secret weapons institutional traders use to spot explosive moves.
Day 1: Introduction to Chart Patterns
Objective: Understand what chart patterns are and why they matter.
✅ What Are Chart Patterns?
Chart patterns are visual formations created by the price movements of stocks or indices on a chart. These patterns are formed by support and resistance levels, trend lines, and volume data.
They help traders:
- Predict future price movement
- Identify entry/exit points
- Gauge market psychology (greed, fear, indecision)
🔄 Types of Chart Patterns
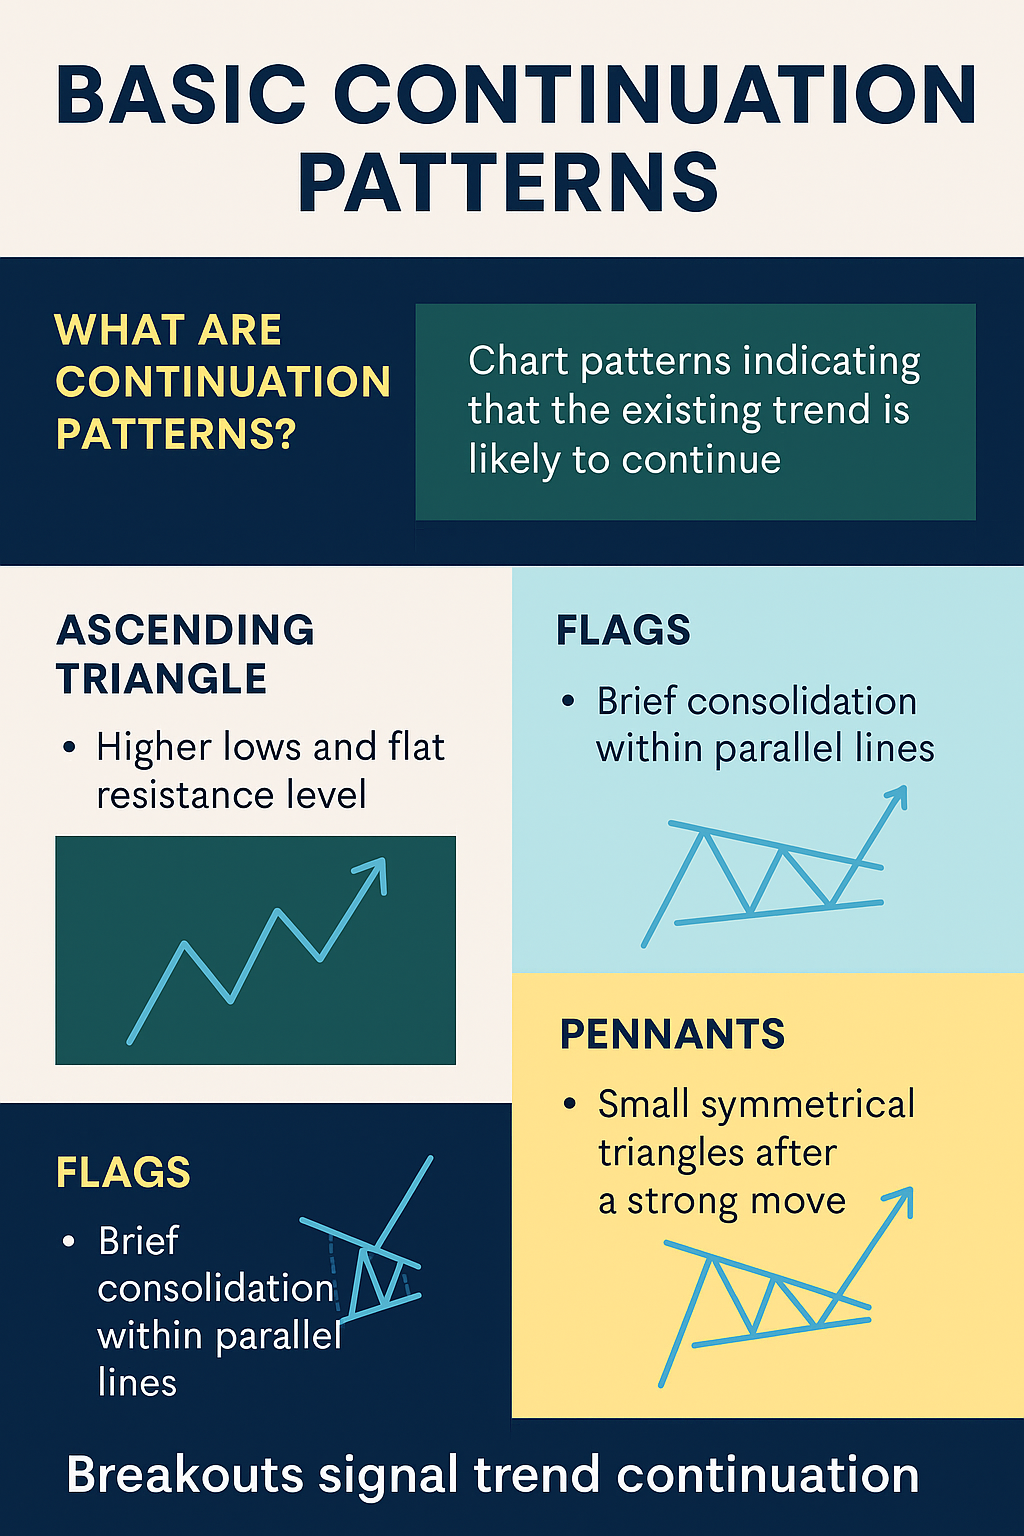
1️⃣ Continuation Patterns
These patterns indicate that the trend (uptrend or downtrend) is likely to continue after a brief consolidation.
Examples:
- Flags
- Pennants
- Ascending/Descending Triangles
- Cup and Handle
🟢 Use these to ride the trend further with better entries.

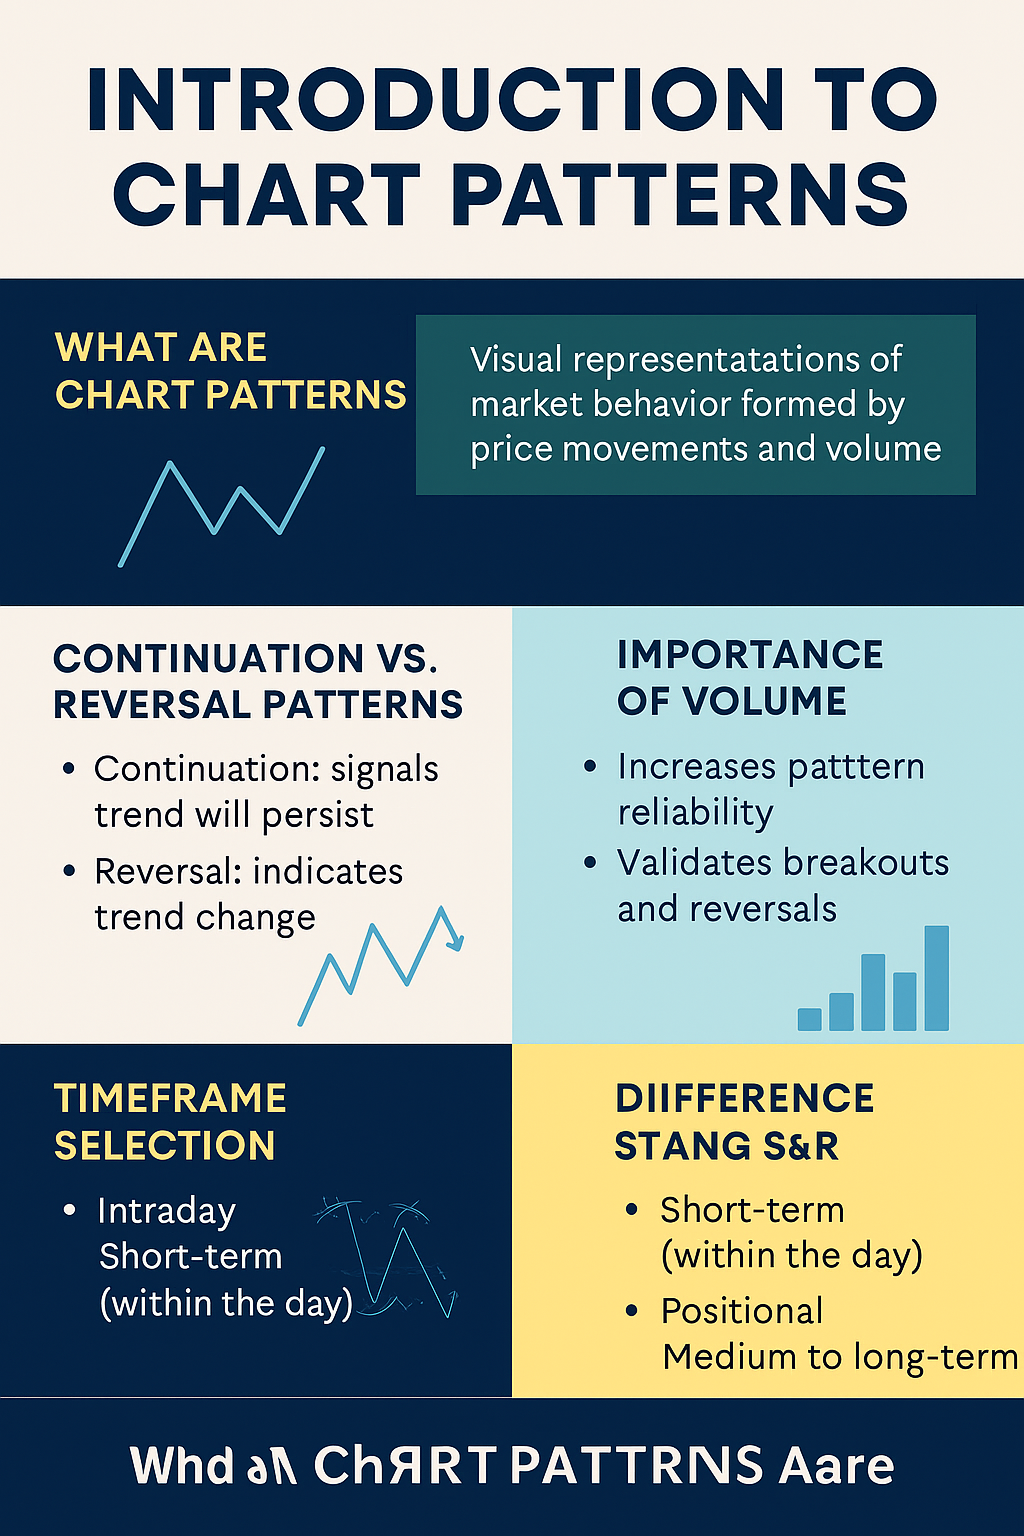
2️⃣ Reversal Patterns
These suggest that the existing trend is about to reverse.
Examples:
- Head and Shoulders / Inverse H&S
- Double Top / Bottom
- Rounding Bottom
- Falling Wedge (Bullish) / Rising Wedge (Bearish)
🔴 Use these to spot early reversal setups and exit before trend changes.
📈 Why Volume Matters
Volume acts as a confirmation tool:
- High volume during breakout = strong move
- Low volume breakout = fakeout trap
- Volume should support the direction of the pattern
📌 Example: A cup & handle breakout without volume often fails.
🕒 Timeframe Selection – Intraday vs Positional
| Purpose | Ideal Timeframe | Patterns You’ll Spot |
|---|---|---|
| Scalping/Intraday | 5-min, 15-min | Small flags, wedges |
| Swing Trading | 1-hour, 4-hour | Triangles, H&S |
| Positional/Investment | Daily, Weekly | Cup & handle, double bottom |
🧭 Rule: Always match your trading style with the right chart timeframe.
📌 Key Takeaways:
- Chart patterns are predictive tools, not guarantees.
- Always use volume + price action together for validation.
- Choose your timeframe based on your trade horizon.
📊 Pro Tip: Patterns work best when supported by volume and aligned with market sentiment.
Day 2: Understanding Support and Resistance Zones
🎯 Objective: Learn how to identify and interpret Support and Resistance levels using charts to improve trade entries and exits.
✅ What is Support?
🔹 Support is a price level where a stock/index tends to find buying interest as it falls.
📉 Price bounces from this level because buyers step in.
📍 Think of it as a floor beneath price action.
🧠 Psychology: Traders believe it’s a “cheap” or fair price → buy more.
🔍 How to Identify Support:
- Recent lows where price bounced multiple times
- Round numbers like 100, 500, 1000 (psychological)
- Moving Averages (like 50 EMA, 200 EMA)
- Trendline touchpoints from previous dips
- Volume spikes near lows = confirmation
✅ What is Resistance?
🔺 Resistance is a price level where a stock/index faces selling pressure.
📈 Price fails to move higher and reverses from this level.
📍 Think of it as a ceiling above price action.
🧠 Psychology: Traders believe it’s “expensive” → start selling.
🔍 How to Identify Resistance:
- Previous swing highs
- Gaps and supply zones
- Fibonacci retracement levels (like 61.8%)
- Volume buildup near peaks
🛠️ Tools to Mark Support/Resistance:
- Horizontal Lines on TradingView/ChartIQ
- Use Pivot Points (S1, S2, R1, R2)
- Trendlines
- VWAP and Anchored VWAP for intraday
🕵️♂️ Breakout vs. Fakeout
🚀 Breakout: When price closes strongly above resistance or below support with volume
🚫 Fakeout: Temporary breach without volume → price reverses back
💡 Tip: Always wait for candle close confirmation + volume.
📊 Support/Resistance in Action (Nifty Example)
- Support: 22680–22700 (price rebounded 3 times in past week)
- Resistance: 23220 (failed breakout twice)
📌 Key Takeaways:
More touches = stronger the level
Support = demand zone; Resistance = supply zone
Always combine volume and price action for reliability
Great for setting targets, stop losses, and entries
Day 3: Identifying Breakout Patterns Using Price Action
🎯 Objective: Learn how to spot real breakout patterns and avoid traps using price action, volume, and candle structure.
🔍 What is a Breakout?
A breakout occurs when the price moves above resistance or below support with momentum and ideally, high volume.
- Bullish Breakout → above resistance
- Bearish Breakdown → below support
Breakouts are early signals of big moves—ideal for intraday, swing, and positional trading.
🧠 Key Breakout Types to Know:
🔹 1. Flat Resistance Breakout
- Price hits the same resistance level multiple times (creates a horizontal line).
- Once broken with volume, strong upside possible.
- ✅ Reliable on Daily + 1H chart.
🔹 2. Trendline Breakout
- Break above a downward sloping trendline.
- Signals reversal of downtrend.
- Use confluence with RSI > 50 or bullish candles.
🔹 3. Volume-Based Breakout
- Breakout with volume spike = genuine interest.
- Volume should be above 20-day average on breakout candle.
🔹 4. Retest Breakout
- After breakout, price comes back to retest the previous resistance → now becomes support.
- Great low-risk entry point.
❌ Avoiding False Breakouts (Traps)
Fake Breakout = trap for early traders.
🔺 Warning Signs:
- Breakout candle with low volume
- Long upper/lower wick (indecisive candle)
- No follow-through next day/session
- Breakout during low liquidity hours (midday)
🛡️ Tip: Combine with RSI/MACD or wait for 2nd candle confirmation.
📊 Real-Life Example (Bank Nifty)
Let’s say:
- Resistance at 51,200
- Price breaks above on 15-min chart with huge volume
- RSI > 60, MACD crossover bullish
- Wait for pullback to 51,200 → 51,250 zone
- Entry: post-retest + bullish candle
🎯 Target: Previous swing high or Fibonacci extension
🛠️ Tools to Confirm Breakouts
- Volume bars
- RSI/MACD confluence
- Trendline/Horizontal line tools on TradingView
- Candle pattern (Marubozu, Bullish Engulfing)
🧩 Summary:
✅ Real breakout = strong price action + volume + follow-through
❌ Avoid entering in low volume or isolated spikes
📌 Retest entries are safer than chasing
Day 4: Drawing Trendlines and Understanding Trend Direction
🎯 Objective: Learn how to draw effective trendlines, spot uptrends/downtrends, and use them to trade with the market—not against it.
📌 Why Trendlines Matter
Trendlines help traders visually track the direction of price movement and identify potential entry/exit zones.
They’re useful for:
- Determining trend strength
- Finding breakout/reversal zones
- Setting stop-loss levels
🔧 How to Draw a Trendline
🔺 For Uptrend:
- Connect two or more higher lows
- Line should slant upward
- Acts as support
🔻 For Downtrend:
- Connect two or more lower highs
- Line should slant downward
- Acts as resistance
✅ Tip: Use at least 2-3 touches for reliability.
📈 Trend Direction Explained
| Trend Type | Structure | What to Do |
|---|---|---|
| Uptrend | Higher Highs + Higher Lows | Look for buying opportunities |
| Downtrend | Lower Highs + Lower Lows | Look for shorting opportunities |
| Sideways | No clear HH/HL or LH/LL | Avoid trading; wait for breakout |
⚒️ Tools for Identifying Trend
- Line Charts: Good for clarity
- Candlesticks: For precision
- Moving Averages: 20/50/200 EMA can confirm trend strength
- Channels: Parallel trendlines that show a trading range
📊 Real-Life Example (Nifty)
- Nifty forms higher lows at 24,380 → 24,550 → 24,720
- Connect these on a 1H chart
- That line now acts as trendline support
- If price respects this and bounces → continue buying
- If price breaks below → trend might be weakening
❗ Common Mistakes
❌ Forcing a trendline where it doesn’t fit
❌ Ignoring volume and price action near trendlines
❌ Drawing from wick to body inconsistently
✅ Be consistent — use either wicks or bodies, not both
✅ Zoom out for larger timeframes to validate trend
🧠 Summary
Wait for price to respect the line before acting
Trendlines = visual roadmap of market direction
Combine with RSI or MACD for trend confirmation
Day 5: Mastering Support and Resistance Zones
🎯 Objective: Learn how to identify and trade support/resistance zones like a pro—including flip zones, supply/demand, and confirmations.
📌 What Are Support and Resistance?
- Support is a price level where buying pressure tends to prevent further decline.
- Resistance is a price level where selling pressure tends to cap further upside.
These levels are psychological, technical, and often repeat.
🔄 Flip Zones: Support Becomes Resistance (and Vice Versa)
A flip zone occurs when:
- Price breaks below support, retests it from below → becomes resistance
- Price breaks above resistance, retests from above → becomes support
✅ Example:
Nifty breaks 24,300 (resistance) → pulls back → holds at 24,300 → new support.
📊 How to Identify Strong S&R Zones
- Multiple Touches: Price has tested the level 2-3+ times
- Volume Confirmation: Higher volume during bounce/rejection
- Price Reaction: Sharp reversal or consolidation near level
- Timeframe Check: Higher timeframe zones = stronger
📉 Difference: Horizontal vs. Dynamic Zones
| Type | Description | Tools |
|---|---|---|
| Horizontal | Static price zones like 24,000, 25,000 | Drawn manually |
| Dynamic | Move with price, like MA or trendline levels | EMA, VWAP, trendlines |
🔍 Confirmation Tools
- Candlestick signals (e.g., pin bar, engulfing at support)
- Volume spike at key levels
- Indicators: RSI oversold near support or divergence
- Price structure: e.g., double bottom near support
🧠 Real Market Example (Bank Nifty)
- Strong resistance at 56,000
- Rejected 3 times → finally broke out on heavy volume
- Retested 56,000 → confirmed flip support
- Fresh entry point for bulls
❗ Pro Tips
✅ Draw zones, not lines – use a band of 10–30 points
✅ Use confluence: combine S&R with RSI, MACD, trendlines
❌ Avoid trading near minor untested levels
✅ Zoom out for weekly/monthly levels for swing trades
📝 Summary
- Support and resistance are the foundation of price action trading
- Combine zones with volume, indicators, and structure
- Wait for confirmation — don’t pre-empt reversals
Volume Analysis & Brekout Strategies
(How Smart Money Moves Markets – And How You Can Follow)
Fun Fact: 80% of breakouts fail without volume confirmation. After today, you’ll know how to spot the real deals!
Objective: Master how to confirm breakouts using volume.
Why Volume Matters (The Market’s Truth Serum)
Volume is the footprint of money – it reveals whether price moves have conviction:
✅ High Volume Breakouts = Strong participation = Higher success rate
❌ Low Volume Moves = Fakeouts = Trap for retail traders
Notice how the valid breakout (right) had 3X average volume vs. the fakeout (left)
The 3 Golden Rules of Volume Analysis
1. Volume Precedes Price
- Rising volume during consolidation = Imminent breakout
- Declining volume during uptrend = Losing momentum
2. Breakout Volume Should Be ≥ 1.5X Average
- Example: If stock normally trades 1M shares/day, look for 1.5M+ on breakout
3. Volume Climax = Exhaustion
- Ultra-high volume after big move often signals reversal
Breakout Trading: Step-by-Step Strategy
Step 1: Identify the Base
Look for these chart patterns:
- Ascending Triangle (Higher lows + flat top)
- Bull Flag (Sharp rally → Small pullback)
- Cup & Handle (U-shaped recovery + small dip)
Pro Tip: The longer the base (3-6 months+), the stronger the breakout
Step 2: Wait for Volume Surge
Valid breakouts show:
- Volume spike when price crosses resistance
- Sustained volume for next 2-3 days
Step 3: Enter with Confirmation
- Buy when price closes above resistance (not just intraday)
- Ideal: 3%+ above resistance level
Step 4: Manage the Trade
- Stop-loss: Below breakout level or recent swing low
- Profit-taking: At 1:2 risk-reward minimum
Real-World Example: Tata Motors Breakout
- Pattern: 4-month ascending triangle
- Breakout Day:
- Price crossed ₹950 resistance
- Volume: 2.8M shares (vs 1.2M avg)
- Result: 22% rally in 3 weeks
Volume Indicators to Supercharge Your Analysis
| Indicator | What It Shows | Ideal Setup |
|---|---|---|
| OBV (On-Balance Volume) | Whether volume supports the trend | OBV making higher highs in uptrend |
| VWAP (Volume-Weighted Avg Price) | Institutional buying/selling levels | Price holding above VWAP = Bullish |
| Volume Profile | Key price levels with most activity | Breakout above high-volume node |
Common Breakout Mistakes to Avoid
❌ Chasing Extended Moves (Breakouts after 15%+ runs often reverse)
❌ Ignering Failed Breakouts (Always respect stop-losses)
❌ Forgetting Sector Correlation (Check if sector is also breaking out)
What to Track:
- Accumulation vs. Distribution
- Volume Spike near support/resistance
- OBV (On-Balance Volume) Indicator
- Volume + RSI confirmation strategy
Real-World Setup:
- Bajaj Finance breakout with volume
- Adani Ports resistance tested 3 times, breakout confirmed with volume spike
⚠️ Avoid Breakout Traps: No volume = High risk of fake breakout.
✅ Bonus Assignment for Week 3
Analyze the chart of any Nifty 50 stock of your choice:
- Identify any chart pattern (H&S, Flag, Cup & Handle)
- Confirm with volume
- Check RSI/MACD alignment
This Week’s Homework
📌 Screen for Stocks: Use TradingView’s stock screener for:
- Price within 5% of 52-week high
- Volume ≥ 1.5X average
📌 Paper Trade: Test 2 breakout setups with virtual money
📌 For more real-time updates, trade setups, and investment insights — follow us on [Telegram] and subscribe to our newsletter!


Educational Blog Disclaimer
Episode 3: Stock Market Beginner’s Weekly Educational
1. Educational Purpose Only
This blog series is purely for educational and informational purposes. The content, including stock examples, strategies, and market analysis, is not financial advice. Always consult a SEBI-registered advisor before making investment decisions.
2. No Guarantee of Returns
Past performance ≠ future results. Stocks, mutual funds, and other securities carry market risks. We do not claim any stock will deliver profits or multi-bagger returns.
3. Conflicts of Interest
- The author/blog may hold positions in discussed stocks.
- This is not a recommendation to buy/sell any security.
4. Data Accuracy
While we strive for accuracy, market data (prices, ratios, etc.) may change after publishing. Verify figures from NSE/BSE/Moneycontrol before acting.
5. Your Responsibility
Investing requires due diligence. You are solely responsible for your capital allocation.
6. Regulatory Compliance
This content adheres to SEBI’s Investor Protection Guidelines. No paid promotions or undisclosed partnerships are involved.