
What are Single Candlestick Patterns? | Complete Guide for Traders 2025
By CapitalKeeper | Beginner’s Guide | Indian Equities | Market Moves That Matter
What are Single Candlestick Patterns?
Candlestick patterns have been a trader’s best friend for centuries. Originating in Japan in the 1700s, candlestick charts provide a visual language that captures market psychology in a single candle. Among them, single candlestick patterns are the most basic yet powerful formations every trader should understand.
In this blog, we’ll break down what single candlestick patterns are, their key types, and how you can use them effectively in today’s fast-moving markets.
🔎 What Are Single Candlestick Patterns?
A single candlestick pattern is formed using just one candlestick on a price chart. Despite their simplicity, these patterns can reveal a lot about the ongoing battle between buyers and sellers.
Each candlestick represents four key price points within a timeframe:
- Open – where the price started
- High – the peak during the session
- Low – the bottom during the session
- Close – where the price ended
The relationship between these four points helps traders interpret market sentiment and forecast potential moves.

📌 Why Single Candlestick Patterns Matter
- Simplicity: Easy to identify without complex indicators.
- Early Signals: Provide quick insight into possible reversals or continuations.
- Works Across Timeframes: Useful for intraday, swing, or long-term investing.
- Psychology Driven: Captures real-time emotions of fear, greed, and indecision.
📊 Key Single Candlestick Patterns
Let’s look at the most popular and widely used single candlestick patterns:
1️⃣ Doji
- Appearance: Open and close are nearly the same, forming a cross-like structure.
- Meaning: Market indecision. Neither bulls nor bears are in control.
- Trading Insight: A strong trend followed by a Doji may hint at a possible reversal.

2️⃣ Hammer
- Appearance: Small body at the top, long lower shadow.
- Meaning: Buyers are stepping in after a sell-off.
- Trading Insight: Found at the bottom of a downtrend, signaling a bullish reversal.
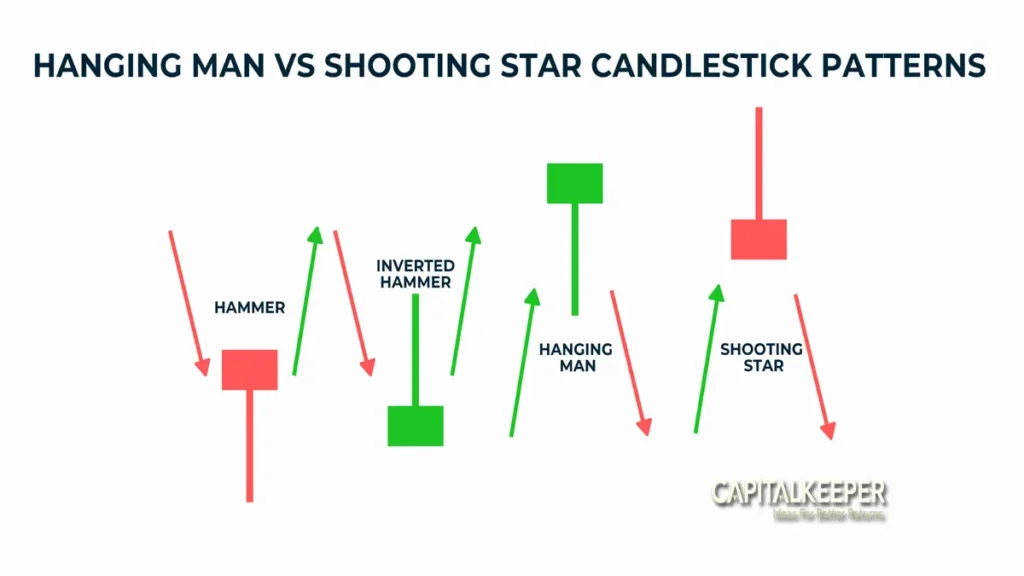
3️⃣ Shooting Star
- Appearance: Small body at the bottom, long upper shadow.
- Meaning: Bears are rejecting higher prices.
- Trading Insight: Appears at the top of an uptrend, indicating a bearish reversal.
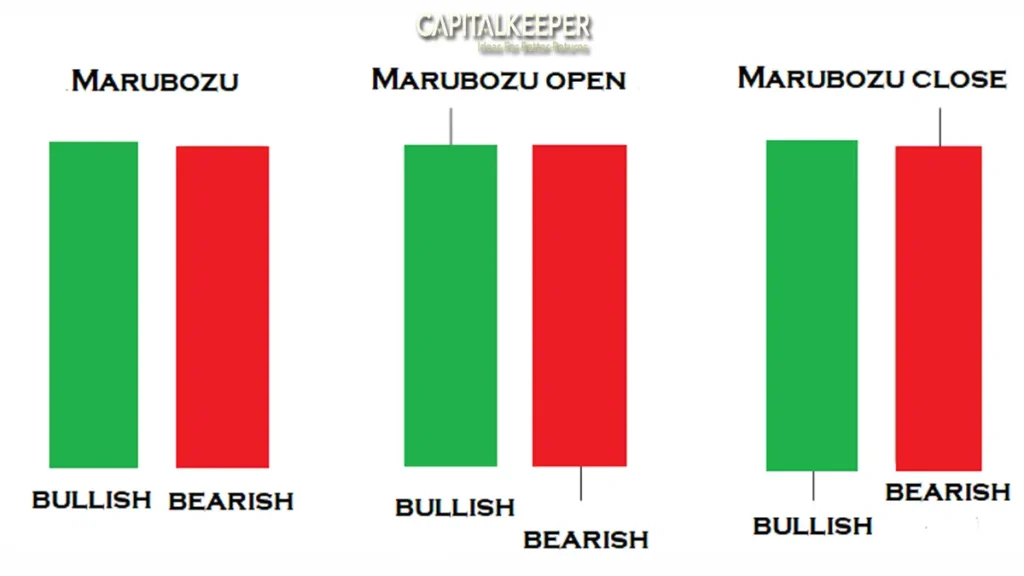
4️⃣ Marubozu
- Appearance: A full-bodied candle with no wicks (shadows).
- Meaning: Complete dominance by either bulls (green candle) or bears (red candle).
- Trading Insight: A bullish Marubozu suggests strong buying momentum; bearish Marubozu suggests strong selling pressure.
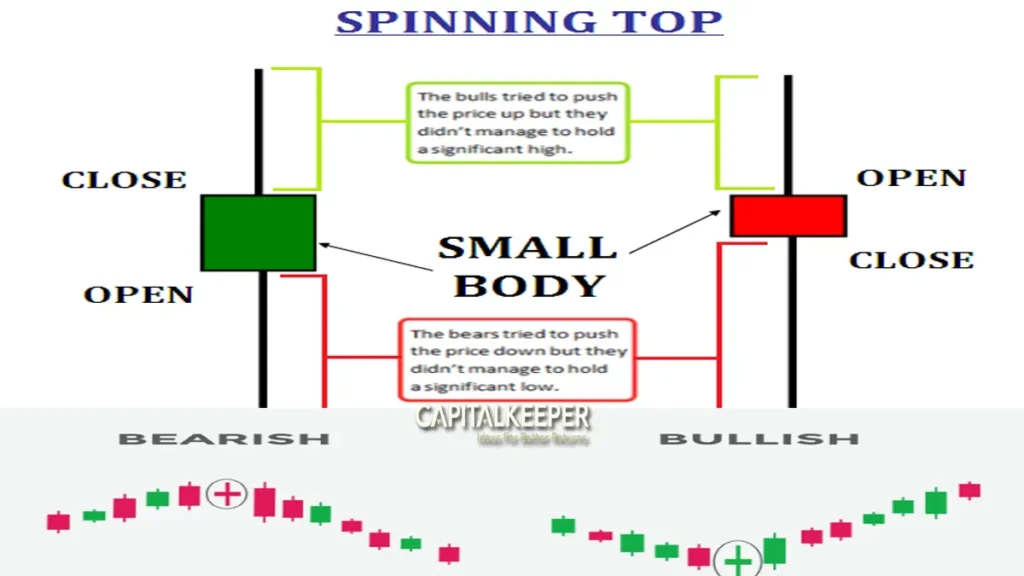
5️⃣ Spinning Top
- Appearance: Small body with long upper and lower shadows.
- Meaning: Market indecision but with volatility.
- Trading Insight: May lead to trend continuation or reversal depending on context.
📈 Practical Tips for Using Single Candlestick Patterns
- Never Trade in Isolation
- Combine candlestick patterns with indicators like RSI, MACD, or moving averages.
- Look at the Trend Context
- A hammer in a downtrend is powerful, but in an uptrend, it may mean nothing.
- Volume Confirmation
- Higher trading volume strengthens the validity of candlestick patterns.
- Timeframe Matters
- Patterns on daily or weekly charts carry more weight than intraday timeframes.
- Risk Management is Key
- Always use stop-loss levels to protect against false signals.
📊 Example: Nifty 50 & Bank Nifty (2025 Market Context)
- In September 2025, Bank Nifty formed a Hammer pattern near support at 54,300, which led to a short-term bounce back toward 55,000.
- Similarly, Nifty 50 printed a Doji around 25,000 after a rally, hinting at investor hesitation before the next breakout attempt.
These real-world examples show how single candlestick patterns remain relevant even in modern algorithm-driven markets.
✅ Pros & Cons of Single Candlestick Patterns
Pros:
- Simple to learn and spot.
- Effective for beginners.
- Works across asset classes (stocks, forex, crypto, commodities).
Cons:
- Can give false signals.
- Requires confirmation with other tools.
- Limited predictive power in isolation.
🚀 Final Thoughts
Single candlestick patterns are the foundation of price action trading. They provide early signals of market reversals, continuations, or indecision, making them invaluable for both beginners and experienced traders.
While they should not be used alone, combining them with technical indicators, support/resistance zones, and volume data can dramatically improve your trading edge.
In 2025, as volatility in markets increases due to global events and AI-driven trading, mastering these simple candlestick signals can help traders make faster and smarter decisions.
✅ Key Takeaway:
Learn to identify Doji, Hammer, Shooting Star, Marubozu, and Spinning Top patterns. Always confirm with trend and volume before acting.
📌 For daily trade setups, technical learning, and smart investing tips, stay tuned to CapitalKeeper.in
📌 For more real-time updates, trade setups, and investment insights — follow us on [Telegram] and [WhatsApp Channel] subscribe to our newsletter!

Subscribe Now , Join Telegram the Crypto Capital Club, Get Free Crypto Updates
📌 Disclaimer
The content provided on CapitalKeeper.in is for informational and educational purposes only and does not constitute investment, trading, or financial advice. While we strive to present accurate and up-to-date market data and analysis, we make no warranties or representations regarding the completeness, reliability, or accuracy of the information.
Stock market investments are subject to market risks, and readers/investors are advised to conduct their own due diligence or consult a SEBI-registered financial advisor before making any investment decisions. CapitalKeeper and its authors are not liable for any loss or damage, direct or indirect, arising from the use of this information.
All views and opinions expressed are personal and do not reflect the official policy or position of any agency or organization. Past performance is not indicative of future results.By using this website, you agree to the terms of this disclaimer.
Ranjit Sahoo
Founder & Chief Editor – CapitalKeeper.in
Ranjit Sahoo is the visionary behind CapitalKeeper.in, a leading platform for real-time market insights, technical analysis, and investment strategies. With a strong focus on Nifty, Bank Nifty, sector trends, and commodities, she delivers in-depth research that helps traders and investors make informed decisions.
Passionate about financial literacy, Ranjit blends technical precision with market storytelling, ensuring even complex concepts are accessible to readers of all levels. Her work covers pre-market analysis, intraday strategies, thematic investing, and long-term portfolio trends.
When he’s not decoding charts, Ranjit enjoys exploring coastal getaways and keeping an eye on emerging business themes.
📌 Follow Ranjit on:
LinkedIn | Twitter/X | Instagram | ✉️ contact@capitalkeeper.in


Leave a Reply