
Volatility Trading & Option Greeks Explained – Delta, Gamma, Theta, Vega, Rho
By CapitalKeeper | Beginner’s Guide | Indian Equities | Market Moves That Matter
Volatility Trading and Greeks: Mastering the Hidden Forces of Options – CapitalKeeper
Introduction
Volatility is the lifeblood of options trading. Unlike equities, where traders primarily focus on price direction, options are deeply influenced by volatility – both historical and implied. For a trader who wants to master options, understanding volatility and the Greeks (Delta, Gamma, Theta, Vega, and Rho) is non-negotiable. This lesson dives into these crucial concepts and shows you how to use them to your advantage.
1. Understanding Volatility in Options
Historical Volatility (HV)
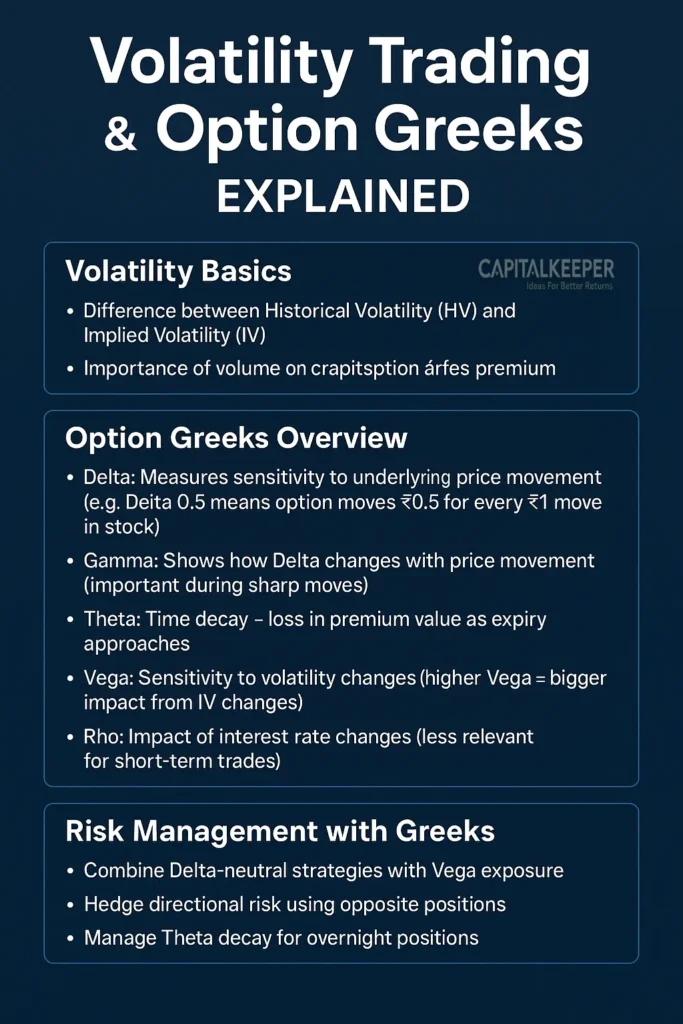
Historical Volatility measures how much a stock’s price has fluctuated over a specific period in the past. It is calculated using standard deviation and gives insight into how “wild” or “stable” a stock has been. For example, if Nifty’s HV over the past 30 days is 12%, it indicates moderate price fluctuations.
Implied Volatility (IV)
Implied Volatility, on the other hand, reflects the market’s expectation of future volatility. It’s derived from current option prices using models like Black-Scholes. High IV often means traders expect big moves ahead (e.g., earnings announcements, RBI policy decisions), while low IV indicates calm markets.
Why IV Matters
- Premium Pricing: High IV inflates premiums, making buying options expensive but beneficial for sellers.
- Event Trading: IV tends to rise before major events and collapse afterward – known as “volatility crush.”
- Strategy Selection: High IV favors credit spreads or selling strategies, while low IV favors debit spreads or buying options.
2. The Greeks: Decoding Option Sensitivities
Option Greeks are risk metrics that tell you how an option’s price reacts to various factors – price movement, time, and volatility.
Delta
- What it Measures: Sensitivity of an option’s price to a ₹1 move in the underlying.
- Example: Delta of 0.5 = option price moves ₹0.50 for every ₹1 move in stock.
- Usage: Helps gauge directional exposure; Delta-neutral portfolios aim to offset bullish and bearish positions.
Gamma
- What it Measures: How Delta changes as the stock price moves.
- Example: High Gamma = rapid change in Delta during volatile moves (useful for short-term traders).
- Usage: Critical during breakouts; high Gamma options become more sensitive near expiry.
Theta
- What it Measures: Time decay – loss in option premium as expiry approaches.
- Example: Theta of -5 = option loses ₹5 per day if all else is constant.
- Usage: Sellers benefit from Theta decay; buyers must time entries precisely.
Vega
- What it Measures: Sensitivity of option price to a 1% change in IV.
- Example: Vega of 10 = premium rises ₹10 for each 1% rise in IV.
- Usage: High Vega strategies (like long straddles) work best before big events with expected IV spikes.
Rho
- What it Measures: Sensitivity to interest rate changes.
- Example: Rho = 2 means option premium increases ₹2 for each 1% rise in interest rates.
- Usage: Less relevant for short-term traders but important in long-term options or LEAPS.
3. Practical Volatility Trading
When IV is High
- Preferred Strategies: Credit spreads, iron condors, short straddles/strangles.
- Why: Selling premium takes advantage of inflated prices and benefits from IV contraction.
When IV is Low
- Preferred Strategies: Debit spreads, long straddles/strangles.
- Why: Buying cheap premium allows for significant profit if volatility spikes.
IV Percentile
- A key metric comparing current IV to its past range (e.g., last 52 weeks).
- IV percentile >70% = consider selling strategies; <30% = consider buying strategies.
4. Combining Greeks for Risk Management
Delta-Neutral Trading
- Balances bullish and bearish positions to limit directional risk.
- Example: Long call + short futures to offset Delta.
Hedging Vega Exposure
- Traders can offset high Vega positions with opposite trades (e.g., long Vega + short Vega) to manage volatility risk.
Managing Theta Decay
- For overnight positions, choose strategies where Theta decay works in your favor (e.g., credit spreads).
5. Real-World Example
Imagine Nifty 50 is trading at 24,600:
- IV rises sharply before RBI policy announcement (high IV environment).
- A trader sells an iron condor (credit strategy) to profit from premium decay after the event.
- Post-announcement, IV collapses (volatility crush) – premiums shrink, and the trader exits profitably.
Key Takeaways
- Volatility is central to option pricing; mastering IV is critical.
- Greeks help traders understand risks beyond price – time, volatility, and interest rates.
- Match your strategy to IV conditions (high IV = selling, low IV = buying).
- Monitor Greeks daily for adjusting positions, especially close to expiry or major events.
📌 For daily trade setups, technical learning, and smart investing tips, stay tuned to CapitalKeeper.in
📌 For more real-time updates, trade setups, and investment insights — follow us on [Telegram] and [WhatsApp Channel] subscribe to our newsletter!

📌 Disclaimer
The content provided on CapitalKeeper.in is for informational and educational purposes only and does not constitute investment, trading, or financial advice. While we strive to present accurate and up-to-date market data and analysis, we make no warranties or representations regarding the completeness, reliability, or accuracy of the information.
Stock market investments are subject to market risks, and readers/investors are advised to conduct their own due diligence or consult a SEBI-registered financial advisor before making any investment decisions. CapitalKeeper and its authors are not liable for any loss or damage, direct or indirect, arising from the use of this information.
All views and opinions expressed are personal and do not reflect the official policy or position of any agency or organization. Past performance is not indicative of future results.By using this website, you agree to the terms of this disclaimer.
Ranjit Sahoo
Founder & Chief Editor – CapitalKeeper.in
Ranjit Sahoo is the visionary behind CapitalKeeper.in, a leading platform for real-time market insights, technical analysis, and investment strategies. With a strong focus on Nifty, Bank Nifty, sector trends, and commodities, she delivers in-depth research that helps traders and investors make informed decisions.
Passionate about financial literacy, Ranjit blends technical precision with market storytelling, ensuring even complex concepts are accessible to readers of all levels. Her work covers pre-market analysis, intraday strategies, thematic investing, and long-term portfolio trends.
When he’s not decoding charts, Ranjit enjoys exploring coastal getaways and keeping an eye on emerging business themes.
📌 Follow Ranjit on:
LinkedIn | Twitter/X | Instagram | ✉️ contact@capitalkeeper.in


Leave a Reply